Jump to:
Procedure | Extension
Ideas | Related Standards | Resources | PBS Resources
INTRODUCTION
Global climate change is a serious environmental problem that is the direct result of human activity. This lesson plan engages students in a real-life exploration of climate change as it is affected by greenhouse emissions from vehicles. The aim of this activity is for students to realize the impact of vehicle use in their family and to give students the opportunity to brainstorm viable alternatives to this use.
GRADE LEVEL
These lesson plans is designed to be used with high school level students, but can be adapted
to other grade levels. (See Extension Ideas).
SUBJECT AREAS
This lesson plan addresses concepts in Environmental Science/Ecology, Chemistry, Physics, Mathematics, and the Social Sciences. The writing exercises also address the study of English and Humanities.
OBJECTIVES
This lesson aims to engage students in a personal exploration of vehicle emissions and what impact they have on the climate. By the end of this lesson, students will:
• understand what the greenhouse effect is and how it works, and how an "enhanced" greenhouse leads to global climate change;
• understand the correlation between fuel economy, greenhouse gas emissions and climate change;
• be able to identify and discuss various transportation alternatives to fuel inefficient cars; and
• recognize which personal actions have an impact on climate change and be able to identify alternatives that have a lesser or no impact.
ESTIMATED TIME NEEDED
Two full class periods (approx. 60 minutes), one week apart.
MATERIALS
• Computer with Internet access
• Diagram of the greenhouse effect to hand out or display in class
PROCEDURE
Day One:
1. Teach the natural greenhouse effect and the enhanced greenhouse effect known as global warming or global climate change. Discuss the four major greenhouse gases, where they come from and how increased emissions affect global climate.
Discuss cars and fuel economy, and how fuel economy impacts climate change. Fuel economy (miles/gallon) depends on engine size, weight of the car, fuel type used, and other stresses put on the engine (i.e. air conditioning).
How Emissions Affect Global Climate — The Basics
• The Natural Greenhouse Effect:
There are four major greenhouse gases in the lower atmosphere that are responsible for regulating global climate: carbon dioxide (CO2), nitrous oxide (N2O), methane (CH4) and water vapor (H2O). These naturally occurring atmospheric gases are what make it possible for us to live on earth. Greenhouse gases absorb solar radiation and convert it to heat, like the glass of a greenhouse. Without these gases the earth would be approximately 60-degrees cooler, making it inhospitable to most life forms.
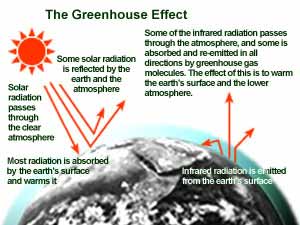 |
Credit: EPA.
(More information about this diagram
can be found at the EPA website.)
|
• The Enhanced Greenhouse Effect, a.k.a. Global Warming:
Especially over the last 200 years of industrialization, human activity has led to excessive amounts of greenhouse gas emissions in the atmosphere. More greenhouse gases mean more solar radiation being converted to more heat, or higher temperatures in the lower atmosphere. These increased temperatures cause polar ice caps to melt, which leads to a rise in sea level and changes in climate patterns throughout the world. Some places are experiencing colder temperatures while others are experiencing warmer ones, which is why some scientists call the "enhanced" greenhouse effect "Global Climate Change" and not "Global Warming."
Most of the extra greenhouse gas in the atmosphere is carbon dioxide (CO2) from the combustion of fossil fuels – coal, oil, gas – in cars, power plants and factories. (See the EPA website for more information on specific greenhouse gas emissions and their various sources.)
The amount of greenhouse gas emissions from vehicles is directly related to fuel economy, or how many miles per gallon of gasoline a car can travel. Cars with higher fuel economy contribute fewer greenhouse gases to the atmosphere, thus having less of an impact on global climate change. See fueleconomy.gov for more information on fuel economy and other reasons why higher fuel economy is important.
2. Class Assignment:
Have each student collect the following data (examples in parenthesis) for all of the cars in their household (keep the data for each car separate):
a. Model Year (1993)
b. Manufacturer (Ford)
c. Model (Explorer 4WD)
d. Engine Size/Transmission Type (6-cyl, 4.0-liter, automatic, 4-sp.)
e. Annual Greenhouse Gas Emissions data for this type of car (11.1 tons/year, can be found at fueleconomy.gov)
f. Odometer Reading Day 1 (15,267)
g. Odometer Reading Day 7 (15,476)
h. Total Mileage for the Week (209 miles)
Day Two (one week later):
3. Calculate the total emissions for each car for each household. Because emissions data is presented in tons/year, students will need to calculate this figure to tons/mile as follows:
a. Emissions data from fueleconomy.gov assumes that each car is driven 15,000 miles per year. Therefore, you must first divide the emissions figure (tons/year) by 15,000 miles in order to get the tons/mile figure needed for this exercise.
• Example:
11.1 tons/year x 1 year/15,000 miles = 0.00074 tons/mile for this make and model of vehicle
b. Now calculate the total emissions that week for each vehicle.
• Example: 209 total miles x 0.00074 tons/mile = 0.15466 tons
c. This may not seem like a very large number, but if you convert this figure in to pounds, you get a more comprehensible number.
• Example:
2,000 pounds/ton x 0.15466 tons = 309.32 pounds in only one week of driving!
• If you drove the same number of miles per week all year long, you get 16,084.64 pounds (309.32 x 52 weeks/year)!!
4. Once all students have calculated the total emissions for their car(s) during that week, hold a discussion around the following questions:
a. How do the emissions totals compare in the class? What was the range of emissions figures in the class and what is the class average?
b. How can our families reduce total greenhouse emissions? (drive less, drive more fuel efficient cars, use mass/public transportation or carpool/rideshare, walk or use a bicycle for short distances, etc...)
c. Compare the class average emissions with a hybrid car (greenhouse gas emissions for various models of hybrid cars are also available at fueleconomy.gov). What is the difference? Would students buy a hybrid car for themselves? Why or why not? Would their family buy a hybrid car? Why or why not? What are the pros and cons of hybrid cars?
d. How important is fuel economy in regulating/minimizing greenhouse gas emissions?
ASSESSMENT SUGGESTIONS
Teachers may assess students by their ability to correctly calculate emissions figures for their car(s). They may also require students to write a short essay/report on their car and answer the questions presented in the class discussion. Students may also want to present their family's car(s) report to the class or to other classes in the school.
EXTENSION IDEAS
• Ecological Footprints – taking it one step further. Have students calculate their ecological footprint, the amount of land that is necessary to sustain their lifestyle based on food, material waste, housing, energy and transportation, by going to myfootprint.org.
• Have students view the Electric Vehicle timeline, then research how the popularity of various cars has changed in their own community over time. What are the most popular vehicles in their community today? Was this type of vehicle always the most popular, or how have cars' popularity changed over time?
• For younger/special needs students – have students look up emissions data at fueleconomy.gov for their family's car(s) and compare it to others in the class and to hybrid vehicles, but do not have students convert the figure to pounds/mile. A class graph could be made by having each student cut out a strip of construction paper whose length, in inches, equals the number of tons/year listed for each type of car. Arrange the strips side by side, from lowest to highest to create a graph. Calculate the class average from this graph and overlay the average in a different color construction paper.
RELATED NATIONAL SCIENCE EDUCATION STANDARDS FOR GRADES 9-12
Science Standards
Science as Inquiry
• Abilities necessary to do scientific inquiry
• Understanding about scientific inquiry
Earth and Space Science
• Energy in the Earth system
• Geochemical cycles
Science and Technology
• Abilities of technological design
• Understandings about science and technology
Science in Personal and Social Perspective
• Personal and community health
• Natural resources
• Environmental quality
• Natural and Human-induced hazards
• Science and technology in local, national and global challenges
Mathematics Education Standards
• Understand numbers, ways of representing numbers, relationships among numbers, and number systems
• Understand patterns, relations, and functions
• Represent and analyze mathematical situations and structures using algebraic symbols
• Use mathematical models to represent and understand quantitative relationships
• Recognize and apply mathematics in contexts outside of mathematics
Health Education Standards (McREL)
• Knows environmental and external factors that affect individual and community health
• Knows how the health of individuals can be influenced by the community
• Knows how individuals can improve or maintain community health
• Understands how the environment influences the health of the community
• Knows how public health policies and government regulations impact health-related issues
• Understands how cultural diversity enriches and challenges health behaviors
RESOURCES FOR TEACHERS AND STUDENTS
American Lung Association
Includes information on various air pollutants, their sources and some alternatives, as well as a plethora of information on
respiratory diseases/ailments.
United States Environmental Protection Agency
Includes detailed information on air quality, pollution, and alternative solutions.
Natural Resources Defense Council
Includes information and articles on clean air and energy, transportation, etc.
The Air Quality Archive
A British website with concise information about the causes of air pollution, effects of air pollution and what people are doing about air pollution.
RELATED PBS RESOURCES
POV's Borders: Environment | AIR: The Air We Breathe, The Cars We Drive
One of biggest factors affecting the quality of the air we breathe is the vehicles we drive. Where better to go looking for the problem and the solution than the Golden State? We met several Californians who were making a different kind of statement with the cars they drive — and for some with the fuels they put in them.
Journey
to Planet Earth: The Urban Explosion
In this lesson plan, students explore urban planning and pollution problems
caused by 20th century urbanization in New York City, Istanbul, Shanghai, and
Mexico
City.
POV's Classroom
POV documentaries are a valuable resource for teachers and students. Use these
companion lesson plans to present POV films to your class.
PBS
Teachersource
PBS showcases the work of hundreds of diverse producers and local PBS stations,
who in turn tap the creative minds of top thinkers from around the world to create
education's best content.
|